September 22, 2026
5m 5s

You cannot attach a debugger to a fleet. Once your firmware is running on thousands of devices in the field, the tools that make bench debugging easy are gone: no breakpoints, no serial console, no way to reproduce the fault a customer just reported on a device hundreds of miles away.
Observability is how you get that visibility back. It comes down to a handful of decisions: how to see what your devices are doing, debug a crash you can never reproduce, and deploy a fix without bricking the fleet, each with a cost attached. By the end, you will know where the hard tradeoffs sit and whether it is worth building yourself at all. The running example is a fleet of refrigeration controllers, but the decisions apply to any constrained device you can’t physically reach.
Before you write any code, decide what you need to know. Observability should not be an afterthought; it starts by naming the questions you will need answered once a device is in the field and you can no longer reach it. Three come up on almost every fleet: Is the fleet healthy right now? Which units, and which firmware versions, are failing? Why did this one device crash? Decide what you need to answer up front, or you may collect data that is not enough to answer these questions when a device finally fails.
To see how that plays out, take a real fleet: around 25,000 refrigeration controllers in grocery back rooms, pharmacy cold storage, and restaurant walk-ins. Each one is an MCU running an RTOS, a control loop that holds temperature and runs a periodic defrost cycle, and a network connection back to the company. The firmware is good. It passed review, it passed the test rig, and it has run for two years.
Then the tickets start. A regional chain reports that a few dozen controllers lock up every couple of weeks. The device stops sending data, and the display holds its last reading. Turning it off and on brings it back, until it locks up again a week or two later. Without observability, all you can do is guess at what went wrong. You read the firmware version off a menu, ask someone to restart it, and finally drive out to swap the unit, which then boots perfectly on the bench. The ticket is closed as not reproducible, and every time it happens again is another truck roll or RMA.
You cannot answer those questions by guessing. Observability can, once you get the device’s own record off it and into something you can query: the events it logged, the metrics it measured, and its state when it crashed.
Getting that record off the device is hard because of how constrained the device is. Whatever collects and sends the data has to live inside the firmware as a small, purpose-built library, and it has almost nothing to work with. You have kilobytes of RAM to spare, not megabytes. The radio is usually the largest power draw on the board, so every byte you send costs energy. The connection drops for minutes at a time. And there is little spare flash. Every decision that follows is a trade-off against these limits.
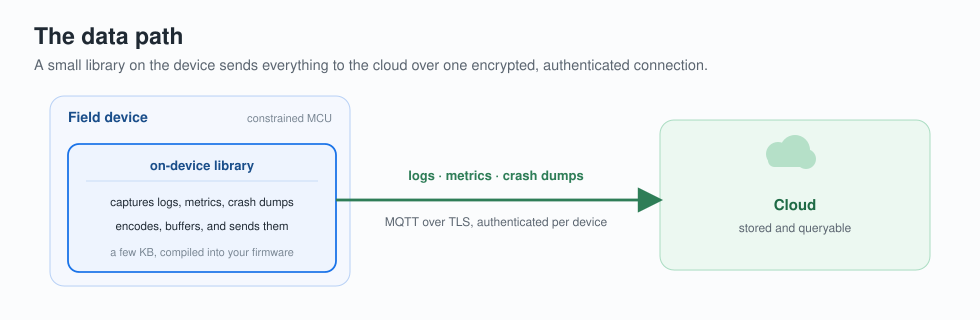
From the questions, you already know what the device sends: mostly small, structured records like log lines and metric samples. The data path that carries them has to be efficient. Every byte the device sends costs power, and on a cellular connection, it costs money too, so it sends less and less often. The device needs a protocol built for slow, unreliable networks, one that keeps a single connection open and adds only a few bytes of overhead per message.
MQTT is a common choice, but not the only one. The connection has to be encrypted, and each device has to authenticate itself, so the backend only accepts data from devices it trusts. In practice, that usually means TLS and a per-device key. Then encode telemetry as a compact binary format rather than something like JSON. That cuts a log line or metric sample to a fraction of the bytes, and fewer bytes means less power and lower cost.
The internet connection will not always be there. A field device drops offline for stretches at a time, so the on-device library should buffer telemetry while it is offline and send it when the connection returns. That buffer is finite, so a long enough outage will overflow it. The lever you have is its size: make it big enough for the outages you actually expect, and accept that anything longer will lose data. Once a message reaches the cloud, it is stored and queryable.
Losing data is one thing; not noticing is worse. If the device numbers its messages, the cloud can count the gaps, so a drop shows up as a number instead of a silent loss. That is the whole data path: a small library on the device sending its record to the cloud over a single encrypted, authenticated connection.
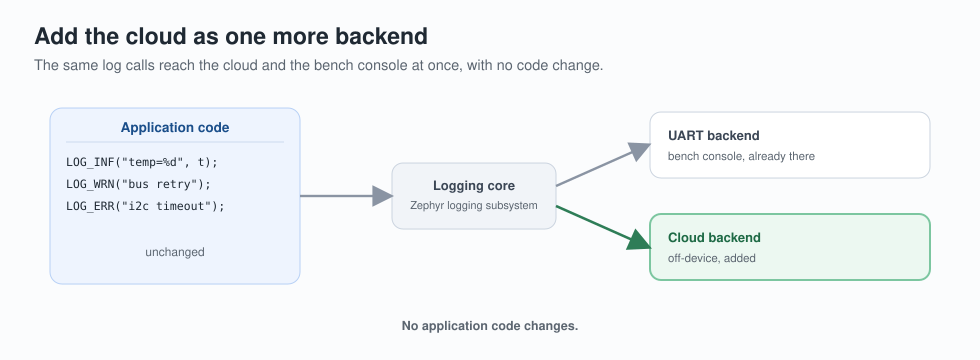
You have a way to send data off the device. What is left is getting the logs and metrics out of firmware that no one is willing to rewrite. So build on what the system already has. Zephyr makes this easy. Its logging subsystem lets one log message fan out to several backends at once, so you add cloud logging as one more backend, and your existing LOG_* calls keep working unchanged. The same messages now also reach the cloud, as shown in the diagram below.
ESP-IDF works differently but reaches the same place: it has a single log output you can redirect, so your existing log calls go to the cloud untouched. FreeRTOS leaves the most to you: it has the logging macros, but nothing behind them to send the messages anywhere. You write that code yourself and point it at the cloud. The effort differs, but the idea holds across all three: reuse the log calls your firmware already makes.
Reaching the broker is only half of it. On the cloud side, the stream still has to be ingested, stored, and indexed before any of it is queryable. Once it is, the logs are yours: filter by device, firmware, or severity, search the message text, and read them back on a timeline.
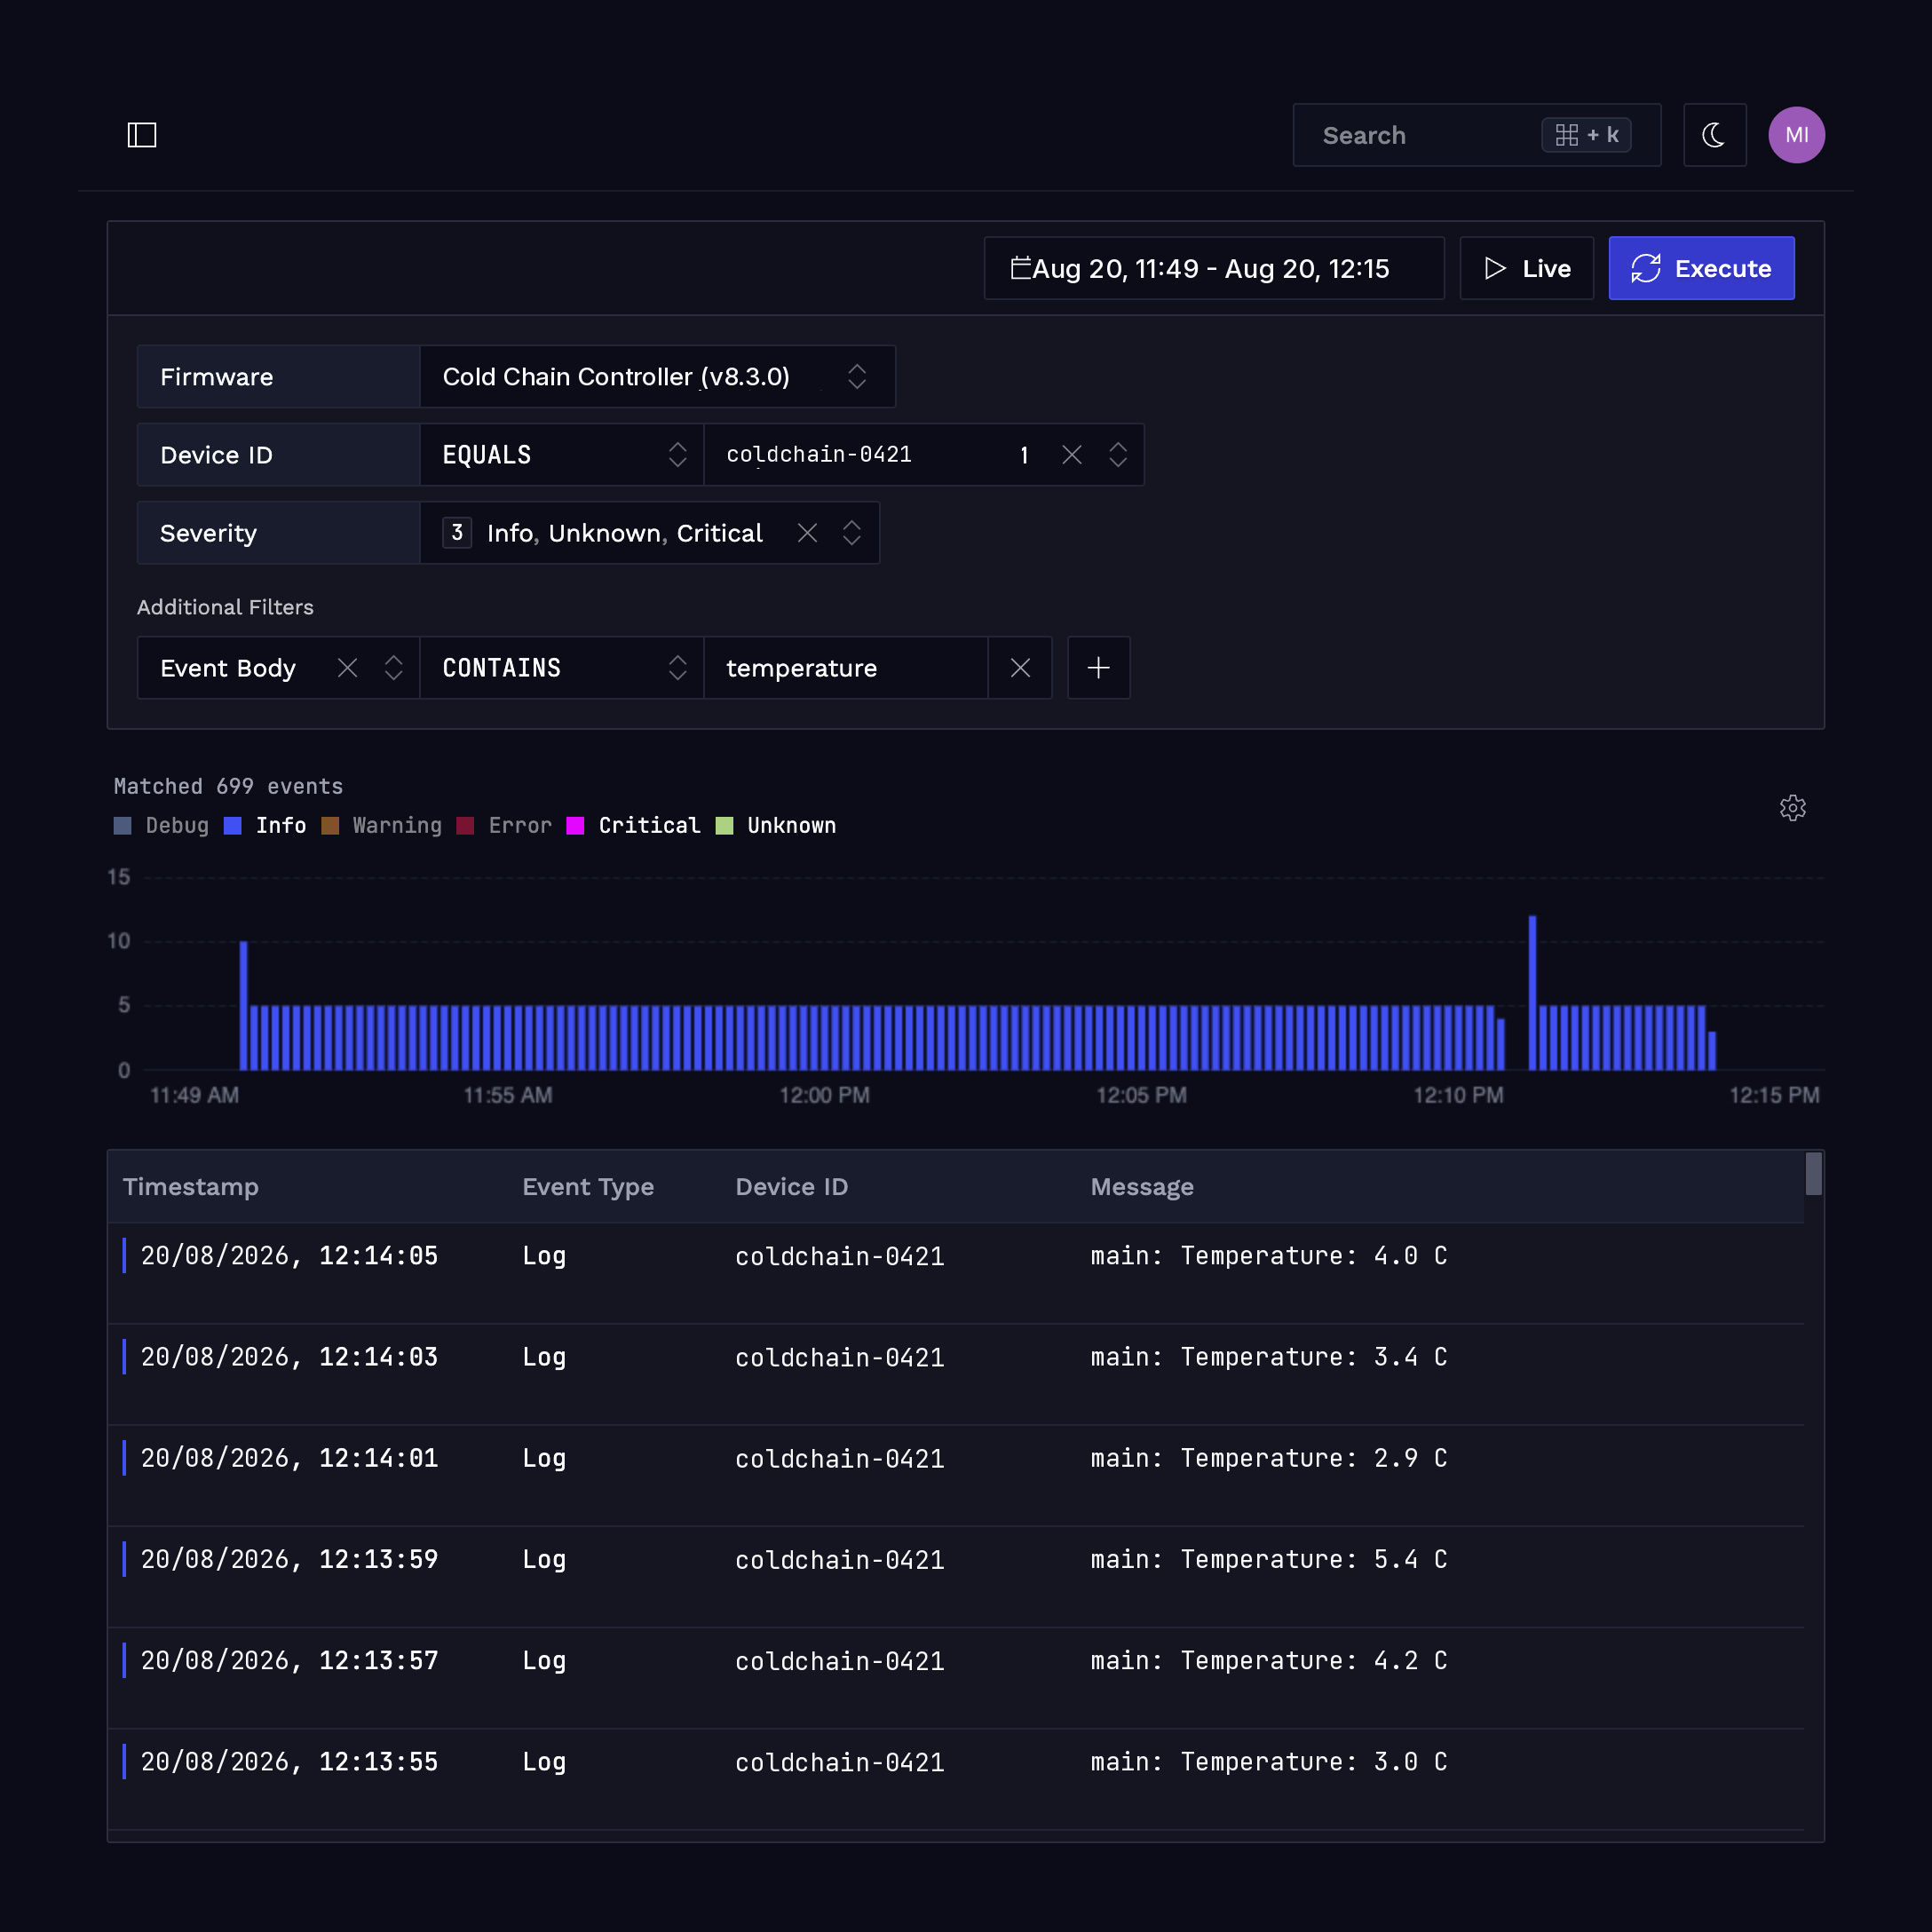
Metrics are different: there is no metrics subsystem to hook the way logging has one. The RTOS exposes a few raw values: free heap space, per-thread stack usage, and CPU load. The library should sample these periodically as built-in metrics, no application code required. You add custom metrics only for what is unique to your firmware.
At fleet scale, the problem is volume, so aggregate on the device: roll each metric into a time window and send its sum, count, minimum, and maximum instead of every reading. That cuts the message count by orders of magnitude, at the cost of per-sample detail.
A separate problem is the device that fails silently. One that has crashed hard sends no error log; it just goes quiet, and if you only watch for errors, a dead unit looks like a healthy one with nothing to report. The fix is a periodic uptime heartbeat: watch for its absence, and the missing sample becomes the alert. Together, the metrics and the heartbeat give you a live health view of every device.
The heartbeat tells you a device died. A crash report tells you why, and it is what the rest of the design was for: a field crash you could never reproduce becomes one you can simply read. The lock-up in the story was a crash. When the fault handler fires, capture a core dump: the CPU registers and a selected slice of stack and RAM, sent up like any other telemetry. Capturing it is the easy part. What you do with those raw bytes is the real question.
On its own, a core dump is just raw register and memory values, with nothing to say what any of it means. To read it, you need the symbols: the mapping from addresses to function names, source lines, and variable layouts. Those symbols live in the ELF, alongside its DWARF debug info, and the ELF stays on your build server. Only the compiled machine code and data get flashed to the device; the debug info never leaves the ELF.
So how do you connect a dump from the field to the right symbols? With a build fingerprint: a short, deterministic hash that identifies the exact build. It is written into the firmware you flash and kept with the ELF you archive, so the two always carry the same fingerprint. When a device sends a dump tagged with it, the backend finds the one matching ELF, and a debugger like GDB loads the two together. Out comes a readable backtrace: function names, source lines, and the local and global variables at the moment of the fault. This only works if you keep the evidence: archive the exact ELF for every build you release.
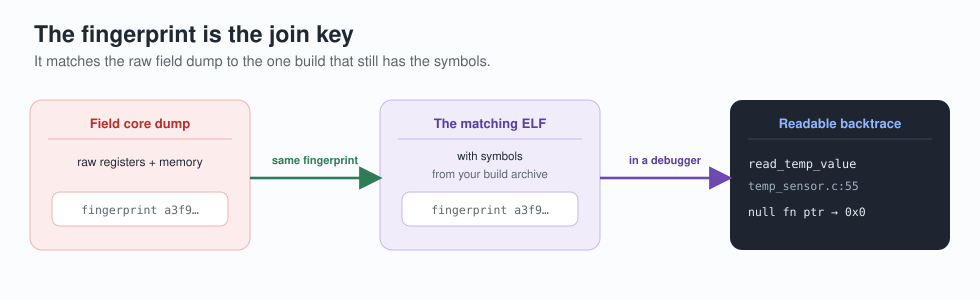
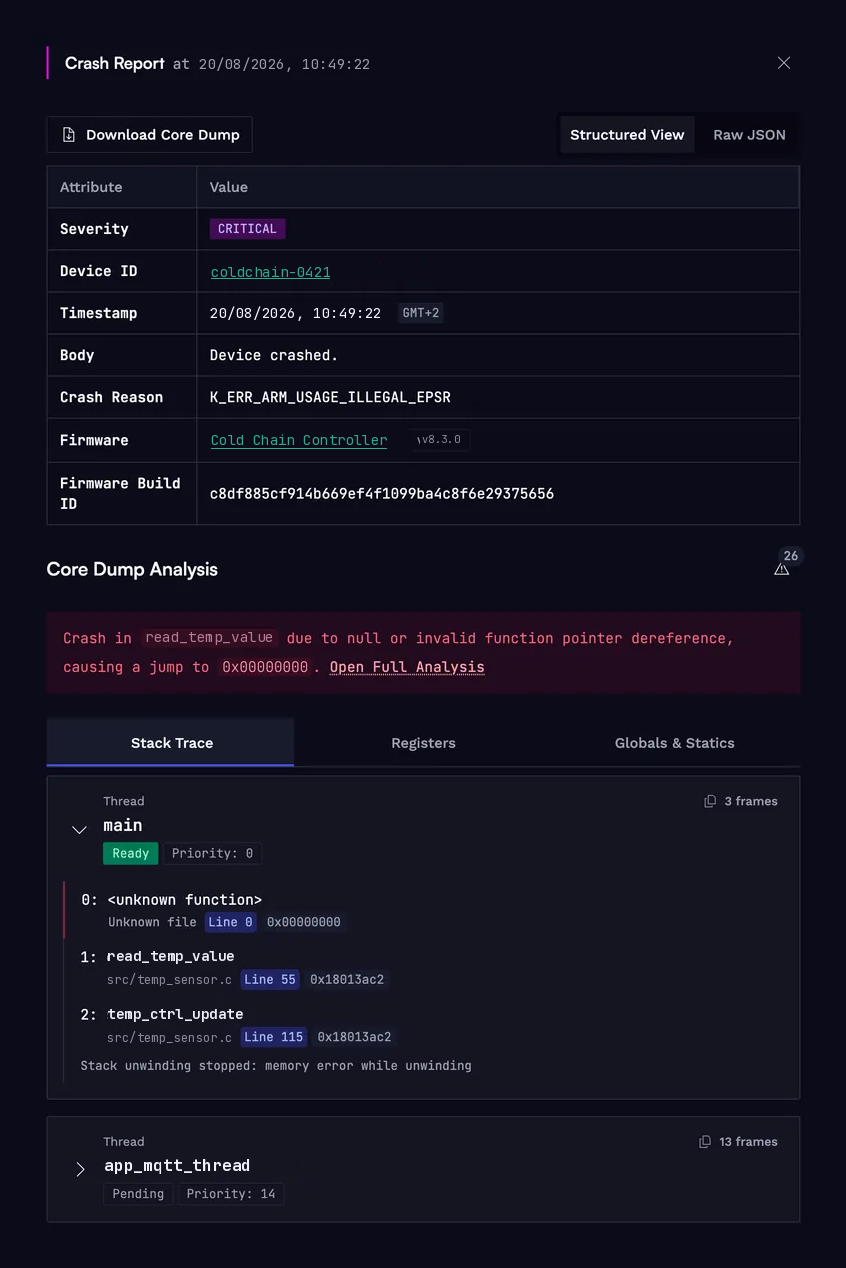
For the refrigeration fleet, the backtrace shows exactly what caused the lock-up. Inside read_temp_value, the code called a function through a pointer that was NULL. Execution jumped to address 0x00000000, the CPU faulted, and the thread went down. Two weeks of not reproducible becomes an afternoon and a one-line null check. You debug the crash that actually happened, not one you had to reproduce first. GDB's backtrace alone is enough to find the bug; an application built for this goes further, adding the fault reason and an automated root-cause summary, like the view below.
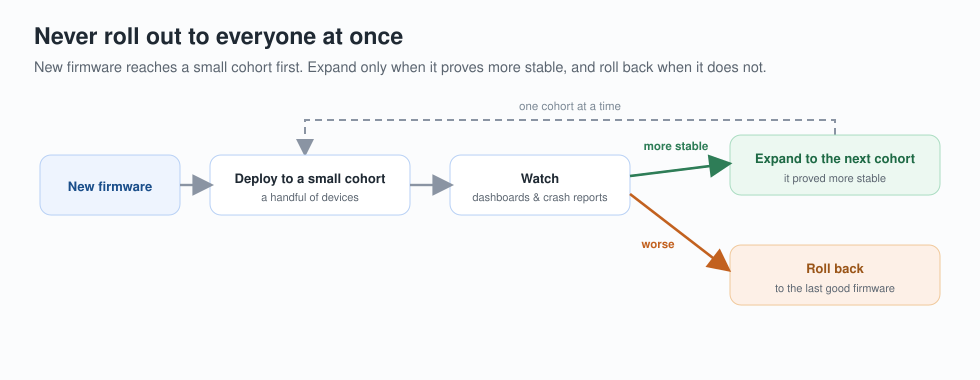
You have the fix, but one bad deployment could break the whole fleet. Never deploy new firmware to 25,000 devices at once. Never push a new build to 25,000 devices at once. Roll it out to a small cohort first and monitor how that cohort behaves (via dashboards and crash reports). Expand only when the new version proves more stable than the old one. If it does not, roll back.
Rolling out cohort by cohort is slower than deploying to the whole fleet at once, but a bad deployment then reaches only one cohort, not the whole fleet. Making it work takes two things. On the device, a firmware path that can fall back to the last known good image if the new one fails to boot. In the cloud, a control that can halt or reverse a rollout before bad firmware reaches everyone. The diagram below shows the rollout, cohort by cohort.
Designing observability in from the start is far easier than adding it later. Decide what you need to know before a device is out of reach. Design within the RAM, power, network, and flash you actually have. Get the data out without wasting bytes or power, and be honest about what you lose when the connection is down. Reuse the logging the RTOS gives you, sample the system values it already exposes, and aggregate before you transmit. Keep symbols off the device, and decode crashes in the cloud. Make every update reversible.
Now add up what those decisions require: a constrained on-device library, a transport that survives a bad connection, off-device symbolication tied to a build archive, a staged update system with rollback, and the storage and dashboards to query all of it. Together, they are a platform, and keeping it running competes with building your actual product.
For most teams, building it from scratch is not worth it. Observability is not the product you sell, and building it in-house ties up the engineers you need on your actual product. The alternative is an existing embedded-observability platform that has already made these decisions, freeing you to spend that effort on the firmware only you can write. Either way, the decisions above are how you tell whether the result, yours or someone else's, is built right.